Details
-
Improvement
-
Resolution: Unresolved
-
 Minor
Minor
-
None
-
None
-
None
-
Bit Sprint 1, Bit Sprint 2
Description
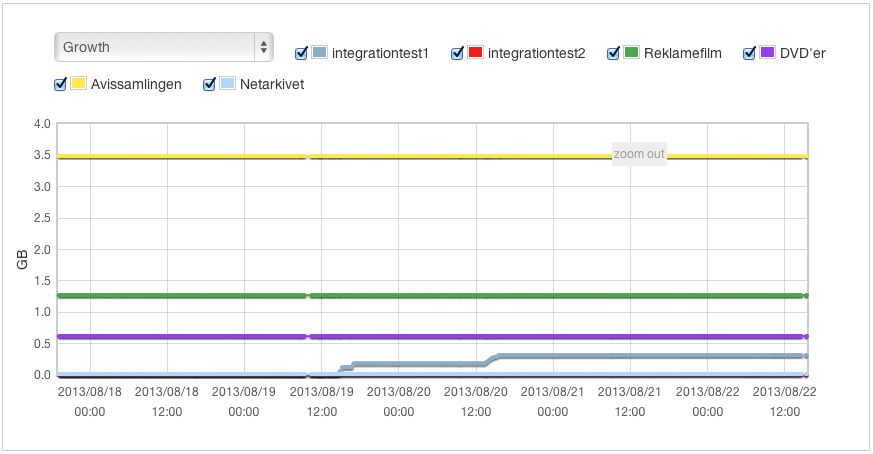
Currently the history chart on the dashboard 'only' shows the last 1000 measurement for the collection. This means that in case of a old or frequently measured collection, the older statistics will never be display.
We should instead be able to display an 'start to now' history by only using a subset of the measurements, 'evenly' distributed in the collections life time. The algorithm for selecting the measurement could be something like:
 if (thisMeasure.getTime - lastMeasurement.getTime > minMeasurementInterval) {
    displayMeasurement(thisMeasure);
 }
Consider implementing the functionality near, or in the database to avoid transferring the full measurement set all the way to the client.
Consider swapping the Flot jQuery library out for a new library e.g. https://www.chartjs.org/
Attachments
Issue Links
- related to
-
BITMAG-1015 Dashboard history becomes very slow after many integrity check
-
- Closed
-